
Study Guide: HTML5 Charts in Hugo
Thanks to the good work of Shen Yu and a global community of hackers, it is now easy to add fancy charts to Hugo Websites. Here are my first experiments.
Thanks
Thanks to the good work of Shen Yu and a global community of hackers, it is now easy to add fancy charts to Hugo Websites. Below are my first experiments.
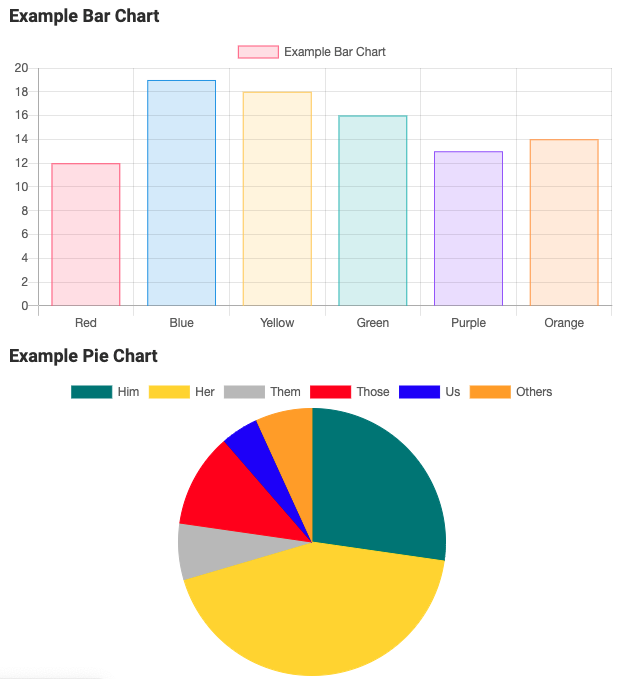
Example Bar Chart
Code for Example Bar Chart
Place the following code between the opening shortcode {{< chart >}} and the closing shortcode {{< /chart >}}.
{
    type: 'bar',
    data: {
        labels: ['Red', 'Blue', 'Yellow', 'Green', 'Purple', 'Orange'],
        datasets: [{
            label: 'Example Bar Chart',
            data: [12, 19, 18, 16, 13, 14],
            backgroundColor: [
                'rgba(255, 99, 132, 0.2)',
                'rgba(54, 162, 235, 0.2)',
                'rgba(255, 206, 86, 0.2)',
                'rgba(75, 192, 192, 0.2)',
                'rgba(153, 102, 255, 0.2)',
                'rgba(255, 159, 64, 0.2)'
            ],
            borderColor: [
                'rgba(255, 99, 132, 1)',
                'rgba(54, 162, 235, 1)',
                'rgba(255, 206, 86, 1)',
                'rgba(75, 192, 192, 1)',
                'rgba(153, 102, 255, 1)',
                'rgba(255, 159, 64, 1)'
            ],
            borderWidth: 1
        }]
    },
    options: {
        maintainAspectRatio: false,
        scales: {
            yAxes: [{
                ticks: {
                    beginAtZero: true
                }
            }]
        }
    }
}
Example Pie Chart
Code for Example Pie Chart
Place the following code between the opening shortcode {{< chart >}} and the closing shortcode {{< /chart >}}.
{
    type: 'pie',
    data: {
        labels: ['Him', 'Her', 'Them', 'Those', 'Us', 'Others'],
        datasets: [{
            label: '# of Votes',
            data: [12, 19, 3, 5, 2, 3],
            backgroundColor: [
                'teal',
                'gold',
                'silver',
                'red',
                'blue',
                'orange'
            ],
            borderColor: [
                'teal',
                'gold',
                'silver',
                'red',
                'blue',
                'orange'
            ],
            borderWidth: 1
        }]
    },
    options: {
        maintainAspectRatio: false,
    }
}
Example Shortcode
{{ $w := default "100" (.Get 0) }}
{{ $h := default "300" (.Get 1) }}
{{ $r := ( .Inner | chomp) }}
{{ $seed := "foo" }}
{{ $id := delimit (shuffle (split (md5 $seed) "" )) "" }}

<div style="width: {{ $w }}%;height: {{ $h }}px;margin: 0 auto">
    <canvas id="{{ $id }}"></canvas>
</div>
<script src="https://cdn.jsdelivr.net/npm/chart.js/dist/Chart.min.js"></script>
<script type="text/javascript">
    var ctx = document.getElementById('{{ $id }}').getContext('2d');
    var options = {{ $r | safeJS }};
    new Chart(ctx, options);
</script>
Links
Related Content
Source: https://class.ronliskey.com/study/hugo/hugo-html5-charts/